June 4, 2020
August 2020 calving traits will reflect lower breed averages
John B. Cole,1 Sophie A.E. Eaglen,2 Thomas J. Lawlor,3 and Ezequiel L. Nicolazzi4
1Animal Genomics and Improvement Laboratory, ARS, USDA, Beltsville, MD
2National Association of Animal Breeders, Madison, WI
3Holstein Association USA, Inc., Brattleboro, VT
4Council on Dairy Cattle Breeding, Bowie, MD
PDF FORMAT
Takeaways
-
Calving traits that previously were problematic for many U.S. dairy farmers have been successfully improved through better genetics and management.
-
In August, Holstein PTAs will average 2.2% for sire calving ease (SCE) and 2.7% for daughter calving ease (DCE)
-
The range of all calving traits will significantly decrease. In August, most Holstein bulls will range from 1% to 4% SCE, while in April most Holstein bulls fell between 4% and 12% SCE.
-
Selection thresholds such as “no bull over 8” are no longer necessary.
-
The stillbirth traits will now be expressed as percent stillbirths to heifers, similar to the calving ease traits.
Introduction
Historically, the PTA calculations for calving ease have been centered on a breed average phenotypic base of 8.0% for Holsteins and 5.0% for Brown Swiss. In April 2020, the calving traits, along with all other traits, were adjusted to a new genetic base to account for the genetic improvement over the last five years. As calving difficulty has been steadily decreasing, dairy producers were surprised to see higher PTAs for calving ease for some familiar bulls. Some bulls had PTAs of 8% to 10%, yet producers saw only 2% to 3% difficulty after many calvings on their own farms.
The word quickly spread after the April evaluations that there was a mismatch between the calving trait PTAs and the actual rate of dystocia and stillbirth on most farms. The article in the May 2020 CDCB Connection (“What is Going on with Calving Ease?”) assured breeders that the bull rankings were correct and that the industry was discussing the best way to express the PTAs.
This article explains the new breed average phenotypic bases that will be implemented in August 2020. For brevity, we will focus on calving ease in Holsteins, and briefly comment on changes to Brown Swiss calving ease and Holstein stillbirth, too.
Improvement in Calving Ease
We can see in Figure 1 that the rate of difficult births to Holstein heifers has decreased substantially over time. This is exciting news – selection for better genetics and improvements in calving management practices have resulted in less dystocia and fewer stillbirths! Cows and calves are healthier, and producers obtain more realized income from investing in better genetics.
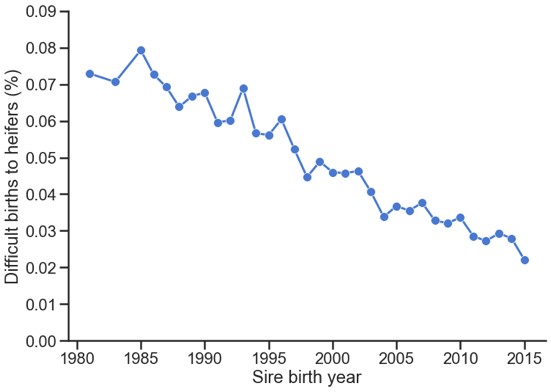
Figure 1. Difficult births to Holstein heifers.
|
Calving ease PTAs continued to increase despite the decreasing incidence of difficult births, because in April we updated the genetic base, but not the phenotypic base. The phenotypic base has been kept constant for several years as the result of an industry-wide strategy to focus on genetics. After the latest genetic base update, this strategy proved to be confusing and had the potential to mislead breeding decisions. As a result, the industry agreed to adjust the phenotypic base to match the observed incidence rates. For the August evaluations, we will adjust the phenotypic base to match the observed incidence rates. In future base changes, both the genetic and the phenotypic bases will be updated.
New phenotypic base in August
The phenotypic bases will change in August 2020, from the current values to the new values shown in Table 1. This will cause the average PTA for calving ease and stillbirth to decrease.
Table 1. Phenotypic base updates computed for calving ease and stillbirth.
|
Breed
|
Trait1
|
Current base (%)
|
New base (%)
|
Change
|
New base year
|
|
Holstein
|
SCE
|
7.9
|
2.2
|
-5.7
|
2015
|
|
|
DCE
|
8.5
|
2.7
|
-5.8
|
2010
|
|
|
SSB
|
8.0
|
5.7
|
-2.3
|
2015
|
|
|
DSB
|
8.0
|
6.6
|
-1.4
|
2010
|
|
Brown Swiss
|
SCE
|
5.2
|
3.0
|
-2.2
|
2015
|
|
|
DCE
|
5.2
|
2.8
|
-2.4
|
2010
|
1SCE = sire calving ease, DCE = daughter calving ease, SSB = sire stillbirth, DSB = daughter stillbirth.
Figure 2 shows the distribution of traditional PTAs (without genomics) for sire calving ease in Holsteins for April and August. The differences between the two curves are very clear. In April most Holstein bulls fell between 4% and 12% for SCE. Come August, most Holstein bulls will range from 1% to 4% SCE. The range of all calving traits will decrease for both Holstein and Brown Swiss, and there will be fewer bulls with extreme PTAs. Changes to the genomic PTAs will be very similar.
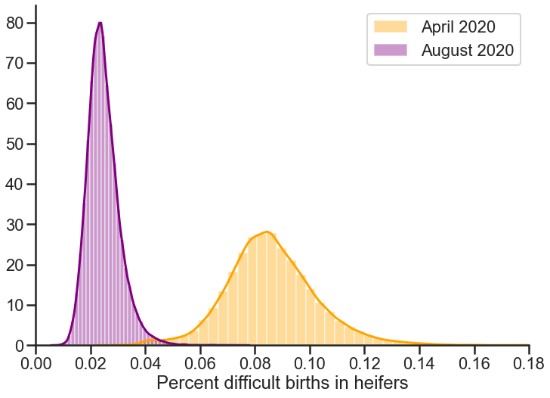
Figure 2. Distribution of sire calving ease PTAs based on the April 2020 and August 2020 bases.
|
The reliabilities of the PTAs will remain the same. This is because a change in the phenotypic base does not affect the amount of information contributing to the PTAs. In other words, the number of available daughter and granddaughter records doesn’t change when the base changes.
We’re also making a more subtle change to the stillbirth evaluations. Before August 2020, the stillbirth PTAs were expressed as the percentage of stillbirths to all animals, both heifers and cows. This is different from the calving ease PTAs, which are based only on first-calf heifers. We’re changing stillbirth from all births to heifers calving for the first time so that all calving traits PTAs will have the same interpretation going forward.
An adjustment to Net Merit (NM$) and other indices, such as TPI, must also be made to account for the lower spread amongst the PTAs. Because the variation in the PTAs is decreasing, both the overall emphasis placed on calving ability (CA$) and individual PTA for NM$ will change. Preliminary calculations by Dr. Paul VanRaden of AGIL suggest that the relative emphasis on calving traits in NM$ will decrease from 5% to about 2%. (The final calculations may differ from this slightly). The approximately 3% emphasis removed from CA$ will be reassigned to other traits, such as early first calving or cow health (HTH$).
How will this affect genetic evaluations for individual bulls?
The ranking of the bulls has always been correct, even with the mismatch experienced in April; however there may be a change in the differences between bulls in August. In Table 2, the example bulls rank exactly the same on their April and August PTAs, but there’s a 0.7 point difference between Riveting and Rome in August where there was previously a 2.2 point difference.
Table 2. Changes in traditional PTAs for sire and daughter calving ease for example Holstein bulls when moving from the April 2020 to the August 2020 phenotypic base.
|
|
|
Sire calving ease (%)1
|
|
Daughter calving ease (%)
|
|
NAAB Code
|
Name
|
April
|
August
|
Change
|
|
April
|
August
|
Change
|
|
001HO12786
|
Piledriver
|
6.1
|
1.6
|
-4.5
|
|
7.1
|
2.2
|
-4.9
|
|
011HO11779
|
Altatopshot
|
6.5
|
1.7
|
-4.8
|
|
6.7
|
2.0
|
-4.7
|
|
007HO13250
|
Jedi
|
7.2
|
1.9
|
-5.3
|
|
5.6
|
1.6
|
-4.0
|
|
029HO17553
|
Josuper
|
8.2
|
2.3
|
-5.9
|
|
6.9
|
2.1
|
-4.8
|
|
014HO14220
|
Riveting
|
10.4
|
3.1
|
-7.3
|
|
8.9
|
2.9
|
-6.0
|
|
014HO14226
|
Rome
|
12.2
|
3.8
|
-8.4
|
|
10.2
|
3.4
|
-6.8
|
|
151HO00690
|
Denver
|
13.4
|
4.3
|
-9.1
|
|
8.9
|
2.9
|
-6.0
|
1The PTAs shown are from the traditional evaluation. Genomic evaluations for August 2020 were not yet available at publication time.
Producers that have used a hard PTA cutoff for calving traits, along with a selection index, can stop using that selection threshold to exclude undesirable bulls. The selection index will ensure that the calving traits are given proper emphasis when ranking bulls.
Does this mean the calving traits are a solved problem?
No, not at all! These results mean we have successfully worked together for many years to get control of a situation that was problematic for many dairy farmers, but it does not mean we can be complacent. The genetic control of calving traits is fairly small (heritability of 3% to 8%), which means that sire selection as well as proper staff training and care in the maternity pen are important to keep dystocia and stillbirth rates low. The stillbirth rate has decreased, so the phenotypic bases will decrease from 8.0% for both sire and daughter stillbirth to 5.7% and 6.6%, respectively. It is unlikely that any of us consider a stillbirth rate of 6% to be acceptable, so it remains important that we select for animals with favorable PTAs for calving traits. Rest assured that selection on indices such as NM$ or TPI will ensure that the calving traits are properly accounted for.
About the authors
Dr. John Cole is the Acting Research Leader of USDA’s Animal Genomics and Improvement Laboratory;
Dr. Sophie Eaglen is the International Program Director at the National Association of Animal Breeders;
Dr. Tom Lawlor is the Executive Director for Research and Development at Holstein Association USA;
and Dr. Ezequiel Nicolazzi is the Technical Director of the Council on Dairy Cattle Breeding.